The SPX and RUT have been incredibly bullish, while the NDX and tech related ETFs are really pulling back. I imagine this doesn't bode well for the SPX and RUT, but as of now the market is not showing signs of rolling over. The SKEW is still below 130, and the down days are limited.
I rolled the RUT calls a couple times and last Friday I put on some RUT bull put spreads knowing that today is historically a very bullish day.
I continue to watch the usual indicators for signs of weakness in the market: the SKEW, the Put/Call Ratio, the VIX term structure and, market breadth. As Oil stay strong and signs of oil demand continue, the market should at least trade sideways if not continue up.
Sideways seems like the way this market could trade over the next few months, and I expect this to be a generally easy time to make money on both the bullish and bearish side.
Monday, May 2, 2016
Monday, April 11, 2016
Low Skew at Market Highs?
Friday was the first day I can remember when an extremely low SKEW (around 113) registered on a market that is in a bullish trend. Low SKEW readings always come when a market is no longer going to fall further after a steep downfall. Today, we got an immediate rally within the first 40 minutes of trade, but after that the markets sold off and closed lower on the day.
Bearishness is creeping up as seen in the uptrend in all measures of volatility. The short term measures of volatility are still below the longer term measures, but the VXST is close to crossing over VIX.

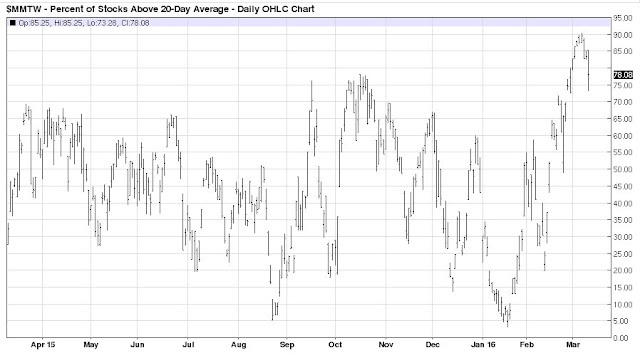
The momentum of the uptrend has been weakening since March 7th, when the percentage of stocks trading above their 20 day moving average hit a very high level of above 90% intraday.


Bearishness is creeping up as seen in the uptrend in all measures of volatility. The short term measures of volatility are still below the longer term measures, but the VXST is close to crossing over VIX.
The momentum of the uptrend has been weakening since March 7th, when the percentage of stocks trading above their 20 day moving average hit a very high level of above 90% intraday.
Our RUT trade is still on to the end of this week. The 1110/1120 call spread has been violated, but since has come back down into an area of profitability. A single good down day this week would allow us to close it out at near full profits. If the market moves up, we will need to roll it out a couple weeks.
The RUT chart shows that the small caps have not been able to gain significant ground in to the low area of the trading range that existed for nearly two years (the area of the blue box). Recently the RSI (bottom line graph on the chart) hit a very high number that has corresponded in the past with pullbacks to at least the lower Bollinger Band on the price chart currently around 1066, about 3% lower).

With options expiration next week, and two days of reversals from highs in the mornings to close at the lows of the day, I suggest we can expect more weakness this week.

Tuesday, March 22, 2016
Almost 8 days up
Yesterday marked 7 positive days on the SPX, and today was nothing of a pullback. The SKEW finally got back over 130 today, so a bumpy ride can be expected over the next few days, I suppose.
The bulls are so in charge that any pullback in the overnight and early morning action is immediately the low of the day. The market closes near the highs of the day every day now for what seems like forever.
The RUT call spreads are close to being at the money, but I wait for the pullback.
Monday, March 14, 2016
SKEW at 133
And the SKEW continues to rise. Most likely this is because of the upcoming Fed meeting. Investors are paying for OTM options, most likely lots of puts, as the Fed is likely to move the market strongly.
Today was a non-event after Friday's big rally. The NDX led and the RUT lagged.
Even after last week's pull backs on Tuesday and Thursday, the market remains overbought in terms of market breadth and price action. If there is any surprise from the Fed on Wednesday, the market will sell off.
But the Fed never surprises.
Today was a non-event after Friday's big rally. The NDX led and the RUT lagged.
Even after last week's pull backs on Tuesday and Thursday, the market remains overbought in terms of market breadth and price action. If there is any surprise from the Fed on Wednesday, the market will sell off.
But the Fed never surprises.
Thursday, March 10, 2016
SKEW at 130
The market traded wildly today, but in almost a predictable fashion. The SPX is not showing signs of real bearishness, but there are some indicators that are giving warning signs.
First, today's SKEW closed over 130. This number is only extreme in the fact that it has been ages since anything around this number has shown up. It used to be that the SKEW above 130 was common place, but I am more concerned about this now as the market is still barely off its high and showing uncertainty.
Second, the percentage of stocks trading above their 20-day moving average hit 90% recently! Previously I mentioned this as being something not since for many years. That percentage closed below 80% today, and seems to have peaked in the short term atleast. I suspect we will need to see a pullback of some magnitude before we can see that number rise again.
Third, the RUT was weak today, and never really rebound. NDX has been weak for days and was down for several days while the SPX was making new highs. This is not the sign of strong market lead by tech and consumer discretionary stocks.
One sign that investors fear has subsided lies in the volatility indexes. VXST traded back below VIX. Actually, VIX was trading higher most of the day, while VXST traded lower. This is bullish.
Today's uncertainty could lead to a bit of a bloodbath tomorrow. Or we can trade higher. Or both, like we did today. Whatever the situation, a set up for a bullish week would suggest upside movement tomorrow is limited.
First, today's SKEW closed over 130. This number is only extreme in the fact that it has been ages since anything around this number has shown up. It used to be that the SKEW above 130 was common place, but I am more concerned about this now as the market is still barely off its high and showing uncertainty.
Second, the percentage of stocks trading above their 20-day moving average hit 90% recently! Previously I mentioned this as being something not since for many years. That percentage closed below 80% today, and seems to have peaked in the short term atleast. I suspect we will need to see a pullback of some magnitude before we can see that number rise again.

Third, the RUT was weak today, and never really rebound. NDX has been weak for days and was down for several days while the SPX was making new highs. This is not the sign of strong market lead by tech and consumer discretionary stocks.
One sign that investors fear has subsided lies in the volatility indexes. VXST traded back below VIX. Actually, VIX was trading higher most of the day, while VXST traded lower. This is bullish.
Today's uncertainty could lead to a bit of a bloodbath tomorrow. Or we can trade higher. Or both, like we did today. Whatever the situation, a set up for a bullish week would suggest upside movement tomorrow is limited.
Monday, March 7, 2016
5th Day Up
Now the RUT and the SPX posted five positive closes in a row. Its been ages since we have had that type of bullishness. Both these indexes sit right around previous support levels, which should act as a bit of resistance in the short term.
Today's market showed signs of tiring. This followed a late day sell off on Friday. Weakness is typical after bullish action when non-farm pay day reports come out. With next week being options expiration, this week should give a set up for the rally next week.
Today the short-term volatility index (VXST) closed higher than the VIX today. This is generally a short-term bearish signal.
We will look for opportunities to close the RUT spread this week, on any pullback, and open some bullish trades for next week.
Today's market showed signs of tiring. This followed a late day sell off on Friday. Weakness is typical after bullish action when non-farm pay day reports come out. With next week being options expiration, this week should give a set up for the rally next week.
Today the short-term volatility index (VXST) closed higher than the VIX today. This is generally a short-term bearish signal.
We will look for opportunities to close the RUT spread this week, on any pullback, and open some bullish trades for next week.
Thursday, March 3, 2016
Continuation
For a third day in a row, the SPX closed higher. The RUT continues to lead, and the QQQs continue to lag. The market rebound is tied to extremely beaten up stocks.
Noticeably important is market breadth is very positive. The last time this many stocks were above their 20 day moving average ($MMTW chart below) was back in mid 2013. In 2011, $MMTW hit a low similar to the recent level and rocketed high up on the chart, similar to what is occurring now, This marked a the last significant low in the market. Could we be starting something so big right now?
In that instance back in 2011, the market traded negative to sideways for several weeks, before the it continued up. A bit of a break in the uptrend seems likely here also.

Today the SKEW moved up a bit, but not very exciting numbers around 125. $TRIN stayed low, around 0.74, but rose from yesterdays extreme low number. More grind higher may come tomorrow. A pullback next week, would set up a bullish options expiration week starting on the 14th.
Noticeably important is market breadth is very positive. The last time this many stocks were above their 20 day moving average ($MMTW chart below) was back in mid 2013. In 2011, $MMTW hit a low similar to the recent level and rocketed high up on the chart, similar to what is occurring now, This marked a the last significant low in the market. Could we be starting something so big right now?
In that instance back in 2011, the market traded negative to sideways for several weeks, before the it continued up. A bit of a break in the uptrend seems likely here also.

Today the SKEW moved up a bit, but not very exciting numbers around 125. $TRIN stayed low, around 0.74, but rose from yesterdays extreme low number. More grind higher may come tomorrow. A pullback next week, would set up a bullish options expiration week starting on the 14th.
Subscribe to:
Posts (Atom)