Thursday, December 17, 2015

What a difference 5 mins can make!

If you thought the market started off the day bad, it ended much worse. Its hard to believe but the day after a follow through day (IBD marked it yesterday), the SPX fell 1.5% today, most of that in the first 2 hours, but then brutally in the last 5 minutes.

The TRIN went crazy today showing selling was wide spread and on heavy volume. It closed at 3.17 a level not seen since September 1st, but was even higher intraday.

Again, the SPX sits around this 2040 level, an important level because it acted as support last Wednesday and acted as the gap area last Friday and again Tuesday.


After the 1% loss in the morning, the SPX bounced off its lower Bollinger Band on the 15-min chart and rallied a bit (see arrow in the charts above). At that point I bought some TNA and TQQQ. The rally only extended to the mid-line on the 15 min chart and then slid down with the declining line. Then everything broke loose about 5 mins before the market closed. 

So, instead of picking the bottom, we have an issue of trying to repair a trade that when wrong. This can be handled with options on those ETFs. We need to sell some OTM calls, and, if the market is weak, use them proceeds to collarize the ETFs with some put buys. Hopefully, we can limit the downside further and wait for some rebound. 

With the TRIN so high, I cannot see much more than 1 day selling. but that maybe a pretty dismal day! 

The SKEW came down today, but still remains above 130. Tomorrow is option expiration. For the major players the options expired today, and tomorrow is just clean up with settlement prices. It can be a bit of a mess in the morning! 

Wednesday, December 16, 2015

IBD calls a Follow Through Day

Today markets rose on strong volume across all sectors. Investors' Business Daily labeled it a Follow Through Day. This designation creates the basis for a bull run that would need several down days on high volume to stop. Based on a trading program worked out over many years, an entrance into leveraged ETFs for Russell 2000 and Nasdaq stocks is warranted on the open tomorrow.

In addition, my trading friend Erin pointed out that a statistic she watches signified a intermediate bottom was in place on Monday also. She looks at the percentage of stocks that trade above their 20 day simple moving average. When less than 20% of stocks are trading above that moving average a possible market bottom has occurred. On Monday, only 16% were trading above their 20 day SMA.


Major news stations pointed to how traders took the FOMC meeting decision as a bullish signal. However, the VIX signal and Erin's research showed that the bullishness started long before this afternoon's rate hike decision. Lets watch to see how bullish the markets can get. SPX 2100 is the first number to break through.

Tuesday, December 15, 2015

VIX signal works magic

The VIX buy signal worked so well, there was really no time to trade it. The market got so bullish so fast, moving 20 points in the first 3 minutes of trade, that I would have had to make the trade yesterday for a reasonable fill. In hindsight, that was the obvious trade to make!

After the initial thrust the market created a trading range between the low of last Wednesday (around 2040) and the close of last Thursday around 2055, from which the markets gapped lower last Friday. This 2040 area on the SPX is interesting as it remains a pivot between bullish and bearish sentiment.


With tomorrow's FOMC meeting on the deck, put buying continued in an excessive manner. The SKEW traded up again, holding above 140 for the 3rd consecutive day. High SKEW readings can signal a coming pullback in the SPX, but usually when the market is already in a strong uptrend. A two day bounce does not qualify. I would expect the SKEW to give us a more normal reading after the FOMC.


Monday, December 14, 2015

VIX gives buy signal

Over the last few days, the VIX has been running up. It went from around 17.5 last Tuesday to an intraday high today of 26.8. This 9+ point move qualifies as a VIX spike (a +3 point move happening over 3 days or less).


The spike itself does not give a reason to buy SPX. However, today's closing print of 22.7 does! As the SPX made a solid move off its lower Bollinger Band line on a 15-minute chart around 8:30 AM (not shown), the VIX just crumbled. The VIX closed more than 3 points from its intraday high giving us a buy signal on the SPX.

In similar fashion the VIX Friday closed above the VXV (a longer term measure of the volatility of the SPX). This is a set up for a bullish move in the SPX if the VIX then closes below the VXV, which it did today!

Today's SKEW, however, is far from supportive of this bullish sentiment.  The VIX did close down sharply from the crazed levels of Friday, but still printed a stratospheric number at almost 141. This is hardly a place to launch a bullish run from. However, with the FOMC getting out of the way as early as tomorrow, the SKEW could fall dramatically and let the market take off into the Santa Claus rally that everyone expects.

Further, I find the RUT's lack of ability to close in positive territory as somewhat disturbing. The RUT really needs to start moving up if the bulls want us to believe that the lower highs and lower lows of this pullback are over.

Wednesday, December 2, 2015

SPX whacked at 2100

Today we had a rather rare situation for bull markets: a complete reversal of a major move up move from the prior day.

The Stochastics are saying this can go much further lower as we just pulled out of the upper region (second graph on the picture below) and even more damning is the RSI graph below. In Early November, the SPX failed to get into the upper overbought area, and on this move back to those highs on the SPX, its RSI is posting a lower high.


The RUT looks most concerning as it took out its support levels of late. Its Stochastics are falling sharply from overbought levels and the RSI never made a new high to support the price high in the index.


VXST is now above VIX which is short term bearish for the market also. I think some bearish positions are warranted here, as the SKEW is still above 130 and the SPX cannot get traction above 2100. We may see a move to 2040 on the SPX.

Monday, November 30, 2015

1st day of the Month

With a pullback today into the 2080 area on the SPX, and now the futures already 0.55% higher, I would expect a positive first trading day of the month. Although the market fell today, the SKEW also fell (a whole 10 points actually) down to 127. Traders were actually buying less puts than last week.

First days of the month are usually strong positive days. If the market opens flat or even down, this will be a great opportunity to get long even for a short term trade.

The RUT continues to be the leading index, probably playing catch up as it has lagged for so long. This is a bullish sign for the markets, also.

Monday, November 23, 2015

Squeezing Profits

While the market is not giving any real directional move, I eked out some profits even in very low volume trading.

I was watching the SPX 15 minute chart, as usual, and the move to the top of the Bollinger Band happened around 7 AM, and moved up for another hour. Then it started to fade off that top BB line.

I watch the SPX with the TTM_Squeeze. When the TTM_Squeeze histogram went from rising (light blue) to falling (dark blue) I entered a 2090/2085 bear put spread for $1.80.


At the time the /ES traded flat and held above the breakout level from the morning (see the horizontal line on the graph below), but then broke below signalling the market could trade lower. Then it rose back into the low end of that trading range, again broke below it and then sharply traded back to the level and then dramatically sold off.


The bull put spread went profitable, but because of the low trading volumes and run up in near term volatility (VXST was trading up 12% at the time), the put spread was very difficult to sell to close it.

So, when /ES started moving up sharply into the close, I added a 2080/2070 bull put spread for $2.55, creating a broken wing put condor.

When all was said and done at the end of the day, I forced a close to make sure I do not have to deal with this tomorrow (around the time of the green arrow on the first graph). I sold the bear put for $2.25 and bought back the bull put for $2.45. A total gain of $0.55 was made on the day.

The best I saw the mid-price on the bear put at any time during the day was $2.50, which is quite disappointing considering the 10 point move in the SPX intraday.

Today's SKEW printed at elevated  levels again (~139). Put buying picks right up when we see any sign of weakness in the market. RUT was strong today and the NDX was the weakest.

Tomorrow is likely the day to get long at the close of trading.

Sunday, November 22, 2015

SPX 3% week, again?

Barron's, along with most other commentators, proclaimed that the SPX gained 3.3% last week (its best week so far in 2015!). From Monday's open to Friday's close, that is a correct calculation. But it is not a full week, nor is it the time period I look at when evaluating a weekly return.

Friday's expiration was interesting in fact. The SPX index opened at 2082.82. However, the monthly options that expired the night before are based on the CBOE SET price, a value based on the price where each of the 500 companies in the index actually opened. The SET came in at 2092.59, almost 10 points higher than the SPX index opening!

The index settlement value at the end of the day was 2089.17, actually showing a full reversal from the highs made during the day.

I, however, watch the Friday to Friday move to determine if we had a true 3% week. From Friday, November 13th's open, even using the higher SET from this Friday, the weekly gain was only 2.3%. So, is there more upside this week? Well, there is room for more as we technically did not have a 3% week last week!

However, the move probably will not be immediate. Although the SKEW printed a relatively low 125 on Friday, the reversal we had on Friday could give us a pullback for the usually bullish Wednesday and Friday trading days this week (see Urban Camel's blog for a great chart of the averages for the days surrounding Thanksgiving).

I will look to sell some call spreads in the AM if we get a good bounce in the morning, but more importantly I want to put on some bullish trades before Wednesday, especially if the market is soft Monday and Tuesday.

Thursday, November 19, 2015

No Pricing

Well, the Iron Condor I discussed putting on through today was the trade everyone wanted, but was impossible to get pricing for. No one would options in a dying market. I watched Iron Condor prices seem to trade at reasonable levels, but the midpoint pricing was not attainable. I am not into chasing a trade, even if it is an easy one. I let it all pass.

Even as the market slid into slightly negative territory, the VIX was falling today. The Bollinger Bands narrowed significantly as the market flat-lined (see chart below). We are in a Bollinger Band squeeze at this time, and that could last a few more days.

Tomorrow is options expiration, but with little news and even after some bad earnings after hours today, I cannot see the market making a strong move in any direction.

Wednesday, November 18, 2015

Fed only adds to the furvor

Today's market was up nicely before the Fed's notes were released. After that, they just flew higher. The SPX is now up substantially this week, and again the 3% standard move comes into play. The rest of this week should be flat, or consolidating slightly. Some jobs numbers are out right before the open, so that will set the tone. I will watch the Leading Indicators number however, because last month it came in negative and this month is expected to be a whopping +6%. If that misses, it would be difficult for strong gains.

I took off the 2015/2005 bull put spread for 35 cents in the morning, logging a gain of $2.90 since last Friday. With the unpredictability of the Fed's notes release and the substantial immediate move, I could not get into another bullish play.

I will look for a wide Iron Condor in the weekly options to capture the expected drift sideways through Friday's expiration after the morning news.

The VIX spike trigger was set off today also, as the VIX closed below 16.85! This is a great signal usually meaning we can expect 20 days of bullish markets. If we respect that move, any consolidation during the next few days will be great entry for Thanksgiving Day bullish season that starts on Wednesday next week.


Tuesday, November 17, 2015

Not so fast!

At today's high, the SPX touched 2066, just about the BB midpoint (described yesterday as an initial target for the bounce) and right at the 9 day Moving Average. This moving average was a good support line during the October rally as the index closed on it twice, but never below it.


 It reversed into negative territory by the close producing an intraday reversal shown as a shooting star candlestick pattern.

This alone should be a warning to the bulls. Additionally, the SKEW printed at 136 and the VIX went up a bit. The RUT continues to lag the market also.

If we get a flat open with no immediate upside, I will take off the 2015/2005 put spreads and look to enter a bearish trade.

However, we have the New Home Starts and Building Permits on the calendar before the open. These have been bullish recently, supporting the market. They could put a rally under this market again tomorrow.


Monday, November 16, 2015

Monday's Big Reversal

Today the SPX gained all of what it lost on Friday and some. It bounced off its lower Bollinger Band line on the daily chart and never looked back, creating a bullish engulfing candle. A simple target for the short term would be the middle Bollinger Band area, around 2070 currently. This is also where the market gapped lower to start its two-day run last week. That gives another 22 points or about 1% potential upside.


VIX was in spiking mode, and technically still is until it closes below 17.80 or thereabouts. Today it closed at 18.16 so a bit more stability is needed. The big news is that on Friday the VXST (short term VIX) traded higher than the VIX, and then closed lower today. Usually, this can be seen as precursor to more volaitility, though not usually immediate. If VIX now closes below 17.80 we are likely to see another 21 trading day bullish period that takes us through the bullish Thanksgiving holiday period.

The 2015/2005 bull put spread trade is now trading for about $1. I will need to roll this up to higher strikes, if the market goes back into bullish mode. I will also be buying leveraged ETFs, TNA and TQQQ.

The selling of last week has evaporated quickly. A bullish options expiration's week is likely followed by a sell off early next week to set up the post-Thanksgiving day rally.

Friday, November 13, 2015

Maybe next week!?

The SPX did move more than 3% (in fact substantially) and the VIX got above 20 this week. These are times when put selling becomes interesting.

The market opened on the high this week and closed on its low. A very one directional move and very bearish. These types of moves have very little follow through to the downside during the next week, with most of them followed by a positive move the next week (see 3-year chart with highlighted down week and arrow pointing to the next weeks candle).


Also, follow through downside moves after a 3% pullback in the SPX is extremely rare. A down week of any magnitude during a options expiration week is also a very rare event.

To follow up with the trades put on this week, the 2030/2020 put spread closed about $7 in the money! Painful. However, I was able to sell an equal amount of 2030/2040 call spreads for 90 cents to cover a bit of that loss, and I sold a larger quantity of 2015/2005 put spreads expiring next Thursday (normal expiration cycle) for $3.25.

Any up day next week should be accompanied by a crush in volatility which would give me a good chance to collect some gains from those spreads.


Thursday, November 12, 2015

Retracements

The SPX is trading at an important level around 2060 this morning, and it seems to be finding support so far.

As you see from the futures (/ES), the level corresponding with 2060 SPX was tested multiple times over the past 3 hours. 


This ~2060 area corresponds nicely with the first target area on the Fibonacci Retracements (23.6%). Usually this first retracement level does not offer great support, but with such a strong bull market run, it may this hold this time. 


The NDX has come back to the breakout level already today also, but has not yet touched its first Fib target area. 


I often watch the markets usual moves and for the SPX that is within 3% on a weekly basis or around 2034 or higher depending on how you measure it. This current sell off seems ordinary, so I would expect the limit to the downside to be within that 3% range by Friday. 


The 2030/2020 bull put spread is selling for about $0.90 cents currently, offering about a 9% return for a 1.5 day trade. 


Sunday, November 8, 2015

High SKEW heading into weak part of November

After reading Urban Camel's weekend post, I see a chance for the market, especially for the NDX, to consolidate gains. We are headed into the very predictable post Thanksgiving day bullish period in two weeks. A bullish move in to the end of the year, needs a set up!

I also remember that the last trading day of October closed with a SKEW of 125, which is average in usual market conditions, but very low considering the recent high SKEW prints we have seen since the market started its up trend in October.

On November the 6th, we saw a market that traded rather weakly, but printed a SKEW of 137. This is not quite the set up for strength going into next week.


Saturday, November 7, 2015

McMillan's Las VegasTraders Expo 2015 Volatility Presentation

Larry McMillan gave a presentation in Las Vegas in October that discussed most of his volatility based market-timing signals. Of course, I follow many of these signals for trading. The VIX spike and the VIX/VXV cross-over are notably valuable. View it on YouTube here.

Wednesday, November 4, 2015

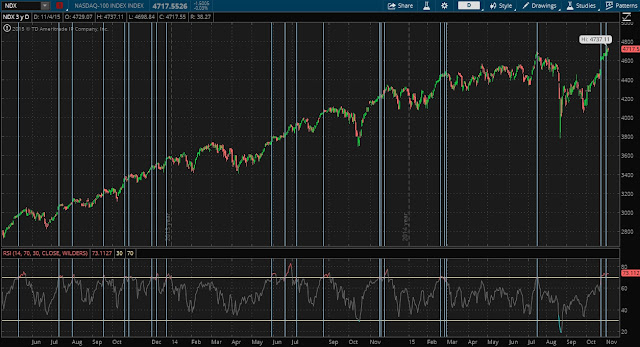
NDX and the RSI


We are in the midst of a run up off the weakness from September, followed by an October that showed the best gains since 2011. The NDX has been leading, RUT has been lagging. This is usual, most people say, for late stage bull market rallies. I do not know if that is true, but it sounds right. 

Below is the 3-year daily graph of NDX plotted with a Wilders RSI in the lower chart area. I lined up the dates where the RSI entered the overbought area. In many cases, there was at least a brief period of pullback, or a slow down in the uptrend after the RSI peaked

NDX and Wilder RSI

It is interesting to note that the SPX has not reached the RSI 70+ zone yet (currently around 66), nor has RUT (currently only 59). Their charts (not shown) do not show periods of weakness as dramatic or consistently as the NDX chart.

Once earnings flush out for the largest NDX members, the NDX may take a breather, and some short call or long put spreads maybe interesting. 

Author:    linkedin small