Tuesday, March 22, 2016

Almost 8 days up

Yesterday marked 7 positive days on the SPX, and today was nothing of a pullback. The SKEW finally got back over 130 today, so a bumpy ride can be expected over the next few days, I suppose. 

The bulls are so in charge that any pullback in the overnight and early morning action is immediately the low of the day. The market closes near the highs of the day every day now for what seems like forever. 

The RUT call spreads are close to being at the money, but I wait for the pullback. 

Monday, March 14, 2016

SKEW at 133

And the SKEW continues to rise. Most likely this is because of the upcoming Fed meeting. Investors are paying for OTM options, most likely lots of puts, as the Fed is likely to move the market strongly.

Today was a non-event after Friday's big rally. The NDX led and the RUT lagged.

Even after last week's pull backs on Tuesday and Thursday, the market remains overbought in terms of market breadth and price action. If there is any surprise from the Fed on Wednesday, the market will sell off.

But the Fed never surprises.

Thursday, March 10, 2016

SKEW at 130

The market traded wildly today, but in almost a predictable fashion. The SPX is not showing signs of real bearishness, but there are some indicators that are giving warning signs.

First, today's SKEW closed over 130. This number is only extreme in the fact that it has been ages since anything around this number has shown up. It used to be that the SKEW above 130 was common place, but I am more concerned about this now as the market is still barely off its high and showing uncertainty.

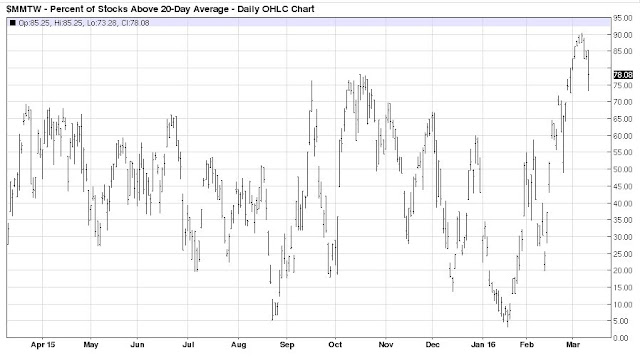
Second, the percentage of stocks trading above their 20-day moving average hit 90% recently! Previously I mentioned this as being something not since for many years. That percentage closed below 80% today, and seems to have peaked in the short term atleast. I suspect we will need to see a pullback of some magnitude before we can see that number rise again.


Third, the RUT was weak today, and never really rebound. NDX has been weak for days and was down for several days while the SPX was making new highs. This is not the sign of strong market lead by tech and consumer discretionary stocks.

One sign that investors fear has subsided lies in the volatility indexes. VXST traded back below VIX. Actually, VIX was trading higher most of the day, while VXST traded lower. This is bullish.

Today's uncertainty could lead to a bit of a bloodbath tomorrow. Or we can trade higher. Or both, like we did today. Whatever the situation, a set up for a bullish week would suggest upside movement tomorrow is limited.

Monday, March 7, 2016

5th Day Up

Now the RUT and the SPX posted five positive closes in a row. Its been ages since we have had that type of bullishness. Both these indexes sit right around previous support levels, which should act as a bit of resistance in the short term.

Today's market showed signs of tiring. This followed a late day sell off on Friday. Weakness is typical after bullish action when non-farm pay day reports come out. With next week being options expiration, this week should give a set up for the rally next week.

Today the short-term volatility index (VXST) closed higher than the VIX today. This is generally a short-term bearish signal.

We will look for opportunities to close the RUT spread this week, on any pullback, and open some bullish trades for next week.

Thursday, March 3, 2016

Continuation

For a third day in a row, the SPX closed higher. The RUT continues to lead, and the QQQs continue to lag. The market rebound is tied to extremely beaten up stocks.

Noticeably important is market breadth is very positive. The last time this many stocks were above their 20 day moving average ($MMTW chart below) was back in mid 2013. In 2011, $MMTW hit a low similar to the recent level and rocketed high up on the chart, similar to what is occurring now, This marked a the last significant low in the market. Could we be starting something so big right now?

In that instance back in 2011, the market traded negative to sideways for several weeks, before the it continued up. A bit of a break in the uptrend seems likely here also.


Today the SKEW moved up a bit, but not very exciting numbers around 125. $TRIN stayed low, around 0.74, but rose from yesterdays extreme low number. More grind higher may come tomorrow. A pullback next week, would set up a bullish options expiration week starting on the 14th.

Wednesday, March 2, 2016

Extremely Overbought

Yesterday was extremely bullish. Usually the market has limited upside after such strength. This was discussed by Urban Camel on his blog's review of the current state of the McClellan Oscillator.

Today the SPX (and RUT) showed continued strength after a weak opening. The current price action is riding the 20-day Bollinger Band line up (see chart below). Usually, such proximity to the 20-day Bollinger Band does not last long without some pullback. Furthermore, the Market Forecast shows an extreme bullish level has been reached with all three lines clustered in the upper reversal zone. This warns of some impending weakness in the next few days.


I have created a triangle pattern to give myself a target of where the markets may eventually run into some serious resistance. The first area would be just above 2000 and the second area could come at the declining trend line drawn off the previous tops. These areas are currently about 1.5% to 3% higher. 

Even with yesterday's bullish price action, the TRIN closed above 1. Today, however, the TRIN closed at 0.42 which also signals that little immediate upside is available. On February 22nd, the TRIN printed at 0.38 and the next day saw a 1.3% down move. I would not be surprised if tomorrow's action is similar. 

Just for reference the RUT outperformed today with a 1% gain. This pushed the price even closer to its 20-day Bollinger Band than on the SPX. The Market Forecast also shows a bearish cluster in the upper reversal zone. The NDX and DIA (Dow Jones Industrials ETF) also finished with bearish clusters on the Market Forecast, but the QQQs just missed one. 

I expect a small pullback before the markets attempt a run into the 2000 area. 


Tuesday, March 1, 2016

First Day of the Month

The first trading day of the month is historically bullish. Today was exceptionally so. After such a strong breakout above 1950, the SPX has a very good chance of testing new highs, never mind the long term downtrend line from the previous peaks.

The SKEW remains low, the VIX has broken decidedly back below 19 and the NASDAQ market led the rally today. All indicators are bullish!

The RUT lagged the market and therefore I sold an April 1110/1120 call spread for 1.60 right at the close today. I expect to trade out of this on any day we have a slight pullback as time decay and a small bearish move will take 50% of the value out of this spread.